


One of the most important considerations for anyone launching a new startup is their potential market size, since it will have a direct bearing on the company’s earning potential and overall valuation (which is also why it’s an integral part of your pitch to investors).
Total Addressable Market – or “TAM” for short – represents the potential revenue from a specific industry and refers to the annual revenue captured if one achieved 100% market share of that particular industry. But the concept of “market size” can be misleading, because the term refers to the revenue across a whole segment of the economy, and often, that’s not the most relevant number to represent your company’s specific area of focus.
Before you start crunching the numbers…
It’s important to have a clearly defined market segment alongside a well-defined profile of the target end user. Additionally, one should have a very specific understanding of both the intended buyers and users.
In order to approximate TAM accurately, the market should be examined in as much detail as possible, because the less specific the inputs used for the calculation, the less meaningful the resulting calculations will be. Bearing this in mind, once you have conducted sufficient primary research into existing companies and markets, you can then begin to estimate TAM through either bottom-up or top-down analysis.
How to crunch: Bottom-Up Vs Top-Down
TAM is calculated by multiplying the number of targetable opportunities by the average selling price of those opportunities. The resulting figure is basically a well-informed estimate of the potential value of the market opportunity, and is usually calculated using two main strategies:
Bottom-up
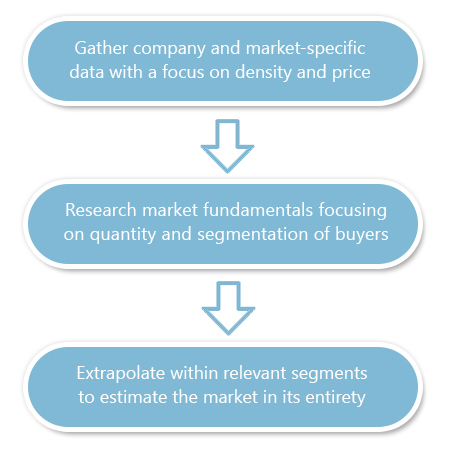
Bottom-up analysis requires a granular look at the market in order to identify, group, and count customers. This entails:
![]() Researching specific companies or customers that have demonstrated a demand for a similar product if it exists and
Researching specific companies or customers that have demonstrated a demand for a similar product if it exists and
![]() Identifying the nature of each customer and estimating the amount being sold to each component group. For example if the ‘customer’ is a company, then you need to take into account the number of “users” within the company who will actually be using your product or service. It may be a company of 200 people in which only 5 people use your product.
Identifying the nature of each customer and estimating the amount being sold to each component group. For example if the ‘customer’ is a company, then you need to take into account the number of “users” within the company who will actually be using your product or service. It may be a company of 200 people in which only 5 people use your product.
Examining a sample of entities at this granular level enables you to make a more educated guess when estimating the density of end users. You can then translate this into TAM by taking the total number of entities in the market segment and multiplying by revenue per user. Broken into steps, the process can be simplified as follows:
Bottom-up Example:
Consider a startup that sells an on-demand dog-walking service with real-time tracking, rating and ordering systems.

The company believes it will disrupt the current US dog-walking market, and they have decided to use the bottom-up methodology in an attempt to utilize their primary market research to arrive at an accurate estimate. The end users are both seniors (over 50) and households that comprise two working parents.
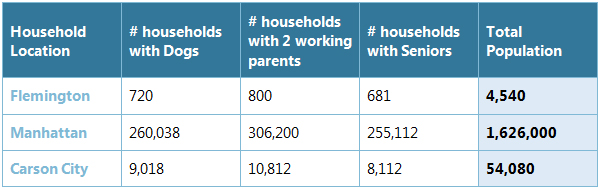
Each of the startup’s 3 founders grew up in a different place: one in Flemington, NJ, another in Manhattan, NY, and the last in Carson City, Nevada. Using each of their personal connections at each location, the founders were able to gather information about the number of households with dogs, the number of households with two working parents, and the number of households with seniors.
The breakdown is as follows:
![]() The founders believe that these 3 locations adequately represent the US market, and calculate a target dog owner density by taking an unweighted average of the densities of their target customers in each location.
The founders believe that these 3 locations adequately represent the US market, and calculate a target dog owner density by taking an unweighted average of the densities of their target customers in each location.
![]() They decided that an unweighted average would be most accurate in this case since the greater number of suburban areas balances out the greater population in urban areas.
They decided that an unweighted average would be most accurate in this case since the greater number of suburban areas balances out the greater population in urban areas.
![]() Additionally, when calculating the number of households with either two working parents or individuals over 50, there was a 40% overlap, which they addressed in their calculation
Additionally, when calculating the number of households with either two working parents or individuals over 50, there was a 40% overlap, which they addressed in their calculation

Once they had calculated the relevant densities, they could use the total population of the US to calculate the number of end users. Based on market research, they determined that the number of dogs per household is independent of the number of working parents or the age of the homeowner, so they multiplied the densities to find the overall percentage:
.1613*.2058 = .033%
Given that the US has a population of 318 million, this yields a total number of end users of:
318m*.033 = 10 million
With an estimated cost per customer per dog of $100 per month, the TAM is approximated at 10m*100 = $1 billion
Note: It’s important to keep in mind that no market remains the same; markets grow and sometimes they shrink. Assuming that you are targeting a growing market, it would be important at the final stage of each analysis to come up with a reasonable assumption for the growth rate of the overall market year over year (YoY). Once you have the growth figure you can project the size of the market for the next few years and in turn your revenue as a function of the market growth (assuming all other variables remain constant).
For example, $1b * 10% growth YoY will lead to a market size of ~$1.6B in five years.
Top Down
Top down analysis can best be explained as a “process of elimination”. You start by taking a large population of a known size that encompasses the target market, and then use that as a base point to narrow down to the specific market segment; with this number, you can isolate end users and multiply by revenue per user to estimate TAM. This process is often represented by an upside-down pyramid where the decreasing population at each level represents a step in the elimination process.
Top Down Example
Consider again the startup selling and on-demand dog-walking service.
The company still believes it will disrupt the current US dog walking market, but this time the founders opted to calculate TAM “top down” in order to address large disparate populations (or perhaps to verify their bottom-up estimation). As such, the end users are the same, and the only difference is the approach used to estimate TAM.
|
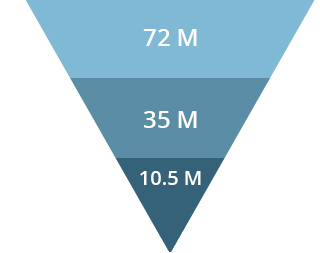 |
So with an estimated cost per customer per dog of $100 a month, the TAM is approximated at 10.5m*100 = $1.05B
The advantage of using both methods
Top down analysis is best used in addition to bottom-up analysis, since top down can be prone to overestimation due to the lack of specificity. Top down analysis is a useful way to provide a vantage point which is broader than bottom up, and it can often be estimated more easily than bottom-up.
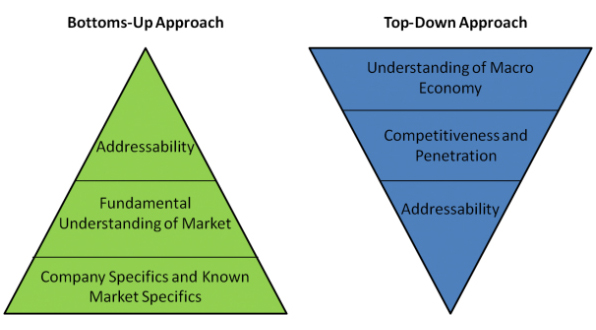
Source: OpenView Partners
Take the latter example of the dog-walking market: Each step in the calculation was based on both approximations and assumptions made in order to arrive at each number. Although it’s probable that more research could have been done in order to perfect the calculations, if you compare the results, they are still within the same general range, which gives each estimate more credibility.
Best practices for building a reasonable and defensible TAM
![]() Be as precise as possible when defining your target market. Usually entrepreneurs start their business with the aim of solving widespread problems or addressing a broad audience, but it’s crucial to be specific when defining a market-segment. With regards to TAM, defining a market loosely can hurt your credibility with investors. It can also invalidate the calculation and confuse the process at multiple levels.
Be as precise as possible when defining your target market. Usually entrepreneurs start their business with the aim of solving widespread problems or addressing a broad audience, but it’s crucial to be specific when defining a market-segment. With regards to TAM, defining a market loosely can hurt your credibility with investors. It can also invalidate the calculation and confuse the process at multiple levels.
![]() To estimate the true size of your TAM, start with a market that’s in your niche, not just a related one. Many startups begin the validation process for their own product by referring to data from research firms and using it as their own initial market size for a top-down estimation. The problem is that this market size is likely way bigger than their own, meaning that their overall calculation will have been based on a false premise. For example, Gartner may say that the pet industry is worth $60 billion, so entrepreneurs in the pet industry space might claim to be dealing with a huge market, when in reality the dog-walking segment is nowhere near that large. So it’s advisable to find industries that are more closely linked to the sector of focus and to narrow down by customer segment in order to avoid major estimate inaccuracies.
To estimate the true size of your TAM, start with a market that’s in your niche, not just a related one. Many startups begin the validation process for their own product by referring to data from research firms and using it as their own initial market size for a top-down estimation. The problem is that this market size is likely way bigger than their own, meaning that their overall calculation will have been based on a false premise. For example, Gartner may say that the pet industry is worth $60 billion, so entrepreneurs in the pet industry space might claim to be dealing with a huge market, when in reality the dog-walking segment is nowhere near that large. So it’s advisable to find industries that are more closely linked to the sector of focus and to narrow down by customer segment in order to avoid major estimate inaccuracies.
![]() Don’t assume that you can achieve success by targeting a small portion of a very large market. For example, you might claim that you can reach 1% of the Chinese market for a low price and still generate high revenues, because you assume that by selling your product for $1.99, you can “easily” make close to $30 million at a conservative 1% penetration estimate. But this type of thinking can hurt your credibility not only by claiming a ‘random’ percentage of market share, but also by implying that you could get exposure to over a billion individuals across China (within a year no less!). A better approach might be to analyze comparable companies or similar industries and use the calculation examples outlined above.
Don’t assume that you can achieve success by targeting a small portion of a very large market. For example, you might claim that you can reach 1% of the Chinese market for a low price and still generate high revenues, because you assume that by selling your product for $1.99, you can “easily” make close to $30 million at a conservative 1% penetration estimate. But this type of thinking can hurt your credibility not only by claiming a ‘random’ percentage of market share, but also by implying that you could get exposure to over a billion individuals across China (within a year no less!). A better approach might be to analyze comparable companies or similar industries and use the calculation examples outlined above.
![]() Avoid claiming that you used a ‘conservative’ estimate when calculating TAM or discussing future market share. These estimates should be regarded as a ‘best guess’, and while it’s fine to condition numbers around particular assumptions (in fact this information can often be beneficial), don’t make an unsupported claim that the numbers you are projecting/estimating are conservative in order to imply that the market is ‘most likely’ bigger. Investors are looking for accuracy and conviction, so it’s important that your estimates for TAM are defensible and well researched, rather than using them as vanity metrics designed to impress.
Avoid claiming that you used a ‘conservative’ estimate when calculating TAM or discussing future market share. These estimates should be regarded as a ‘best guess’, and while it’s fine to condition numbers around particular assumptions (in fact this information can often be beneficial), don’t make an unsupported claim that the numbers you are projecting/estimating are conservative in order to imply that the market is ‘most likely’ bigger. Investors are looking for accuracy and conviction, so it’s important that your estimates for TAM are defensible and well researched, rather than using them as vanity metrics designed to impress.
![]() Make a point of studying your competitors. Competitive research can be a highly useful source of information when conducting a bottom-up analysis regardless of differences in the competitor companies’ size or whether they are public or private. TAM is a representation of the market’s demand for a product or service, and having a deep understanding of the current players can be a powerful asset.
Make a point of studying your competitors. Competitive research can be a highly useful source of information when conducting a bottom-up analysis regardless of differences in the competitor companies’ size or whether they are public or private. TAM is a representation of the market’s demand for a product or service, and having a deep understanding of the current players can be a powerful asset.
Mini Glossary:
![]() Total Addressable Market (TAM) is the annual revenue captured if one achieved 100% market share in the area of focus.
Total Addressable Market (TAM) is the annual revenue captured if one achieved 100% market share in the area of focus.
![]() Serviceable Available Market (SAM) is the share of the total addressable market that your company target/plans to target
Serviceable Available Market (SAM) is the share of the total addressable market that your company target/plans to target
![]() Share of Market (SOM) is the realistic percentage of the market a business holds or plans to capture
Share of Market (SOM) is the realistic percentage of the market a business holds or plans to capture
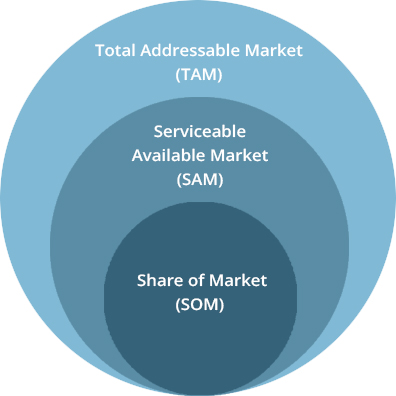
A visual representation of TAM, SAM & SOM
NOTE: Special thanks to Matt Cohen who interned with us this summer at Viola Ventures for his help with the preparation of this post.
More posts by Alon Amar:
![]() Don’t fumble your financials: How to manage your Cap Table like a pro
Don’t fumble your financials: How to manage your Cap Table like a pro
